GFA Symbols and Legend: How to Read a GFA in Canada
Looking for today’s GFA? The live charts are on NAV CANADA’s Collaborative Flight Planning Services site at plan.navcanada.ca. Open the Weather tab, pick your GFA region, and you’ll get the current clouds and weather and icing, turbulence and freezing level charts.
This page is the other half: what every line, colour and abbreviation on those charts actually means. The old AWWS site is gone, so if a bookmark stopped working, that’s why.
Every pilot in Canada learns to read a GFA, and most of us learn it badly the first time. You stare at a map covered in red scallops, green hatching and little text boxes full of abbreviations, and you pull out the one number you think you need. That’s how people miss a line of CB forecast to 40,000 feet right across their route.
The Graphical Area Forecast is the best big picture weather product you have for VFR flying in Canada. A METAR tells you what’s happening at an airport right now, and a TAF forecasts the next day or so at that airport. The GFA forecasts what’s going to happen in between them. Here’s how to read one properly, with all the GFA symbols and abbreviations, and two real charts from August 2026 decoded the way I’d walk a student through them in a briefing.
- What a GFA is
- GFA regions in Canada
- Start with the title box
- Clouds and weather chart
- Precipitation and obstruction symbols
- Icing, turbulence and freezing level chart
- Complete GFA symbols legend
- Worked example: Ontario and Quebec
- Worked example: Yukon and NWT
- GFA abbreviations
- Frequently asked questions
What is a GFA in Canada?
The GFA is a set of forecast charts prepared by Environment and Climate Change Canada for NAV CANADA. It forecasts the most likely weather over a large area from the surface up to 24,000 feet.
Each issue has six charts. There are three clouds and weather charts and three icing, turbulence and freezing level charts, and each pair is valid at a different time: the issue time, six hours later and twelve hours later. New GFAs come out four times a day, about half an hour before 00Z, 06Z, 12Z and 18Z. The third clouds and weather chart also carries an IFR outlook covering a further 12 hours.
Keep one thing in mind the whole way through. A GFA is a forecast. Every cloud base, front position and icing layer on it is what a forecaster expects to happen, not what’s happening. It’s the best guess available when you plan, and it’s only as good as the forecast. That’s why you check it against the METARs, PIREPs and what you see out the window once you’re flying.
Two things catch new students out. All times are UTC, not local. And all heights are in hundreds of feet above sea level unless the chart says AGL. A cloud base of 40 on a GFA is 4,000 feet ASL, not 4,000 feet above the field. If you’re flying out of Calgary at 3,600 feet elevation, that’s a very different day than it would be in Toronto.
GFA regions in Canada
Canada is split into seven GFA regions. The code in the top right corner of every chart tells you which one you’re looking at.
| Chart code | Region |
|---|---|
| GFACN31 | Pacific (British Columbia) |
| GFACN32 | Prairies (Alberta, Saskatchewan, Manitoba) |
| GFACN33 | Ontario and Quebec |
| GFACN34 | Atlantic |
| GFACN35 | Yukon and Northwest Territories |
| GFACN36 | Nunavut |
| GFACN37 | Arctic |
If your flight runs near a boundary, pull up both regions. Weather doesn’t stop at the edge of the chart.
Start with the title box, every time
Before you look at the map, read the box on the right side of the chart. It tells you the region, which chart it is (clouds and weather, or icing, turbulence and freezing level), when it was issued and when it’s valid. The single most common GFA mistake I see is someone briefing off the 12 hour chart when they’re departing in an hour.
The title box also has a legend with notes that apply to the whole chart. These are easy to skip and they matter:
HGT ASL UNLS NOTED means heights are above sea level unless marked otherwise.
CB TCU AND ACC IMPLY SIG TURB AND ICE means any cumulonimbus, towering cumulus or altocumulus castellanus on the chart comes with significant turbulence and icing, even if nobody drew it.
CB IMPLIES L LVL WS means cumulonimbus brings low level wind shear with it.
NIL-LGT RIME ICEIC ABV FZLVL UNLS NOTED, NIL-LGT TURB UNLS NOTED means only moderate and severe icing and turbulence get drawn. Nil to light rime icing above the freezing level and nil to light turbulence are assumed everywhere else.
That last note is the one to remember. A blank icing chart doesn’t mean no ice. It means nothing worse than light.
Underneath the legend is the comments box. The forecaster puts anything that doesn’t fit on the map in here. On the Ontario and Quebec chart further down, that’s where the wildfire smoke warning is.
How to read the GFA clouds and weather chart
The clouds and weather chart forecasts cloud layers, visibility, weather, obstructions to vision, surface winds, and the pressure systems and fronts driving all of it.
Cloud areas
Areas of cloud are enclosed by red scalloped lines. Inside each area the forecaster writes the cloud amount, and the tops and base as a fraction, in hundreds of feet ASL. Tops go on top and the base goes underneath:
BKN CU 80/40 reads as broken cumulus, tops 8,000 feet, base 4,000 feet ASL.
Cloud amounts use the same terms as a METAR:
| Code | Meaning | Sky coverage |
|---|---|---|
| SKC | Sky clear | 0 oktas |
| FEW | Few | 1 to 2 oktas |
| SCT | Scattered | 3 to 4 oktas |
| BKN | Broken | 5 to 7 oktas |
| OVC | Overcast | 8 oktas |
Convective cloud tops can be forecast above 24,000 feet, and they’re worth paying attention to. Forecast CB tops of 350 or 400 tell you the forecaster expects a very unstable airmass. On the Ontario chart below, CB tops are forecast to 40,000 feet along the cold front. Nobody in a light aircraft is getting over that, so the only question is where to go around it or whether to go at all.
How much of the area is affected
A cloud or weather area on the GFA doesn’t mean the whole area is expected to be covered. The forecaster tells you how much with a coverage qualifier, and convective and non-convective weather use different words:
| Coverage | Convective (CB, TCU, showers) | Non-convective (fog, stratus, steady rain) |
|---|---|---|
| 25% or less | ISOL, isolated | LCA, local |
| More than 25% up to 50% | OCNL, occasional | PTCHY, patchy |
| More than 50% | FRQ, frequent | XTNSV, extensive |
Older references write isolated as ISOLD. The current charts print ISOL.
Visibility, weather and ceilings
Visibility is in statute miles, up to 6. Anything better is written as P6SM. Weather uses the same codes as a METAR, so 1SM +TSRA BR is one mile in heavy thunderstorm rain and mist. When the forecaster expects ceilings lower than the general cloud base, they add them separately, like CIGS 5 AGL, and note that one is above ground, not sea level.
Surface winds
Surface winds are only drawn when the sustained speed is 20 knots or more, with gusts after a G, like 20G30. In convective areas you’ll often see a gust value on its own, like G45KT next to the CB. That’s the forecast thunderstorm gust, and gusts like that flip aircraft on the ramp.
Fronts, pressure systems and isobars
Highs, lows and fronts are drawn with their forecast direction of movement and speed in knots. A low with an arrow and a boxed 20 is forecast to move that way at 20 knots. You can use that with the chart scale to estimate where the front should be halfway between chart times, which is usually when you’ll be flying. Treat that as an estimate. Fronts speed up, slow down and stall, and the next issue of the GFA may move it.
Isobars are drawn every 4 hPa. Tight isobars mean a strong pressure gradient and strong winds, and wide spacing means light winds. The full list of front and pressure symbols is in the legend table below.
IFR outlook
The last clouds and weather chart of each issue has an IFR outlook for the 12 hours after it’s valid. It only covers IFR weather, meaning forecast ceilings below 1,000 feet AGL or visibility below 3 miles. If you’re planning a late afternoon return, that outlook is often the most useful thing on the whole set.
Weather is where most PPAER marks are lost
GFAs, TAFs, METARs and PIREPs are all on the Transport Canada private pilot exam, and weather is where a lot of students drop marks. Our Private Pilot Ground School teaches it the way it’s used in the cockpit, by airline pilots who read these charts before every flight.
- Full meteorology section with real Canadian weather products
- Practice exams built from thousands of student attempts
- Letter of recommendation when you pass our practice exams
GFA precipitation and obstruction symbols
Precipitation and obstructions to vision are shown with coloured outlines. Green is precipitation, orange is things like fog, haze and smoke, and red is freezing precipitation. A solid line means continuous and a dashed line means intermittent or showery.
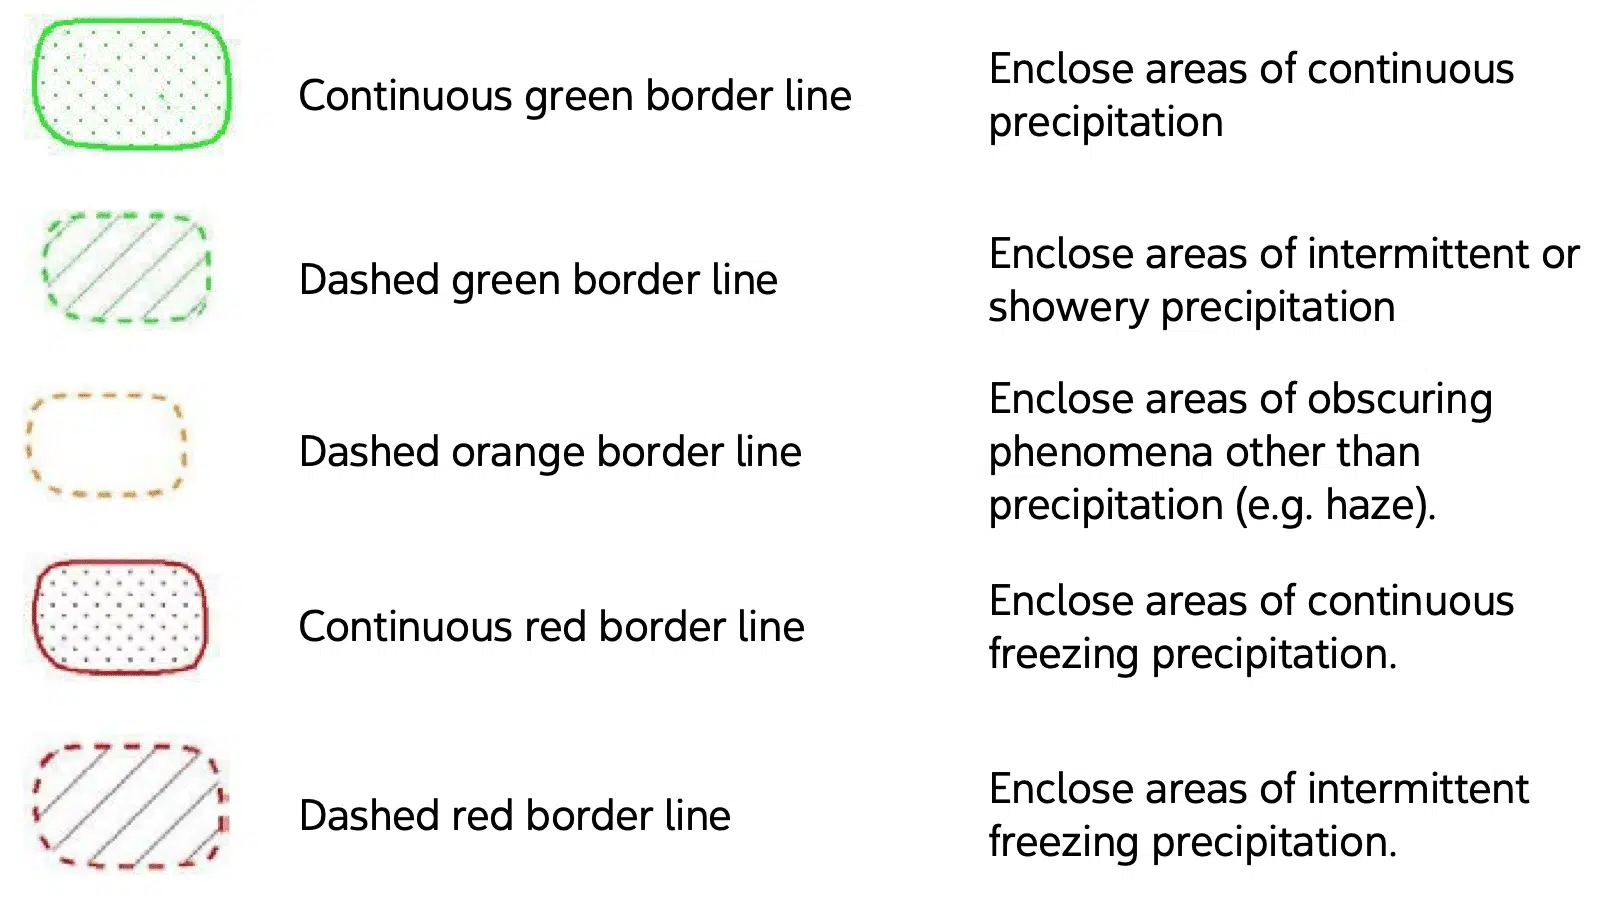
If you see red on the clouds and weather chart, stop and read it carefully. Freezing rain and freezing drizzle are the reason a lot of Canadian winter flights shouldn’t happen.
How to read the icing, turbulence and freezing level chart
This is the chart people skip. Don’t. It forecasts areas of moderate and severe icing and turbulence, with the type, intensity, base and tops of each, plus freezing level contours across the whole region.
Icing
Icing areas are outlined in blue. Light stippling inside is moderate icing and dense stippling is severe. Inside or next to the area you’ll find the type and the vertical extent, with tops over base in hundreds of feet ASL. The types are rime, MX for mixed and CLR for clear.
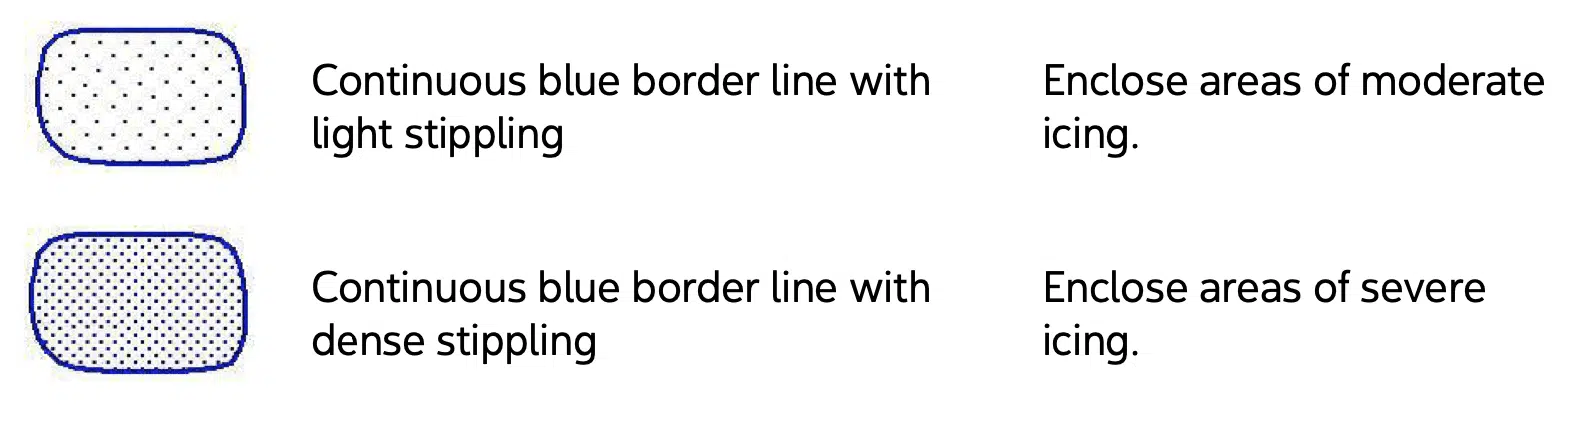
A label like MX 130/FZLVL means mixed icing forecast from the freezing level up to 13,000 feet. Often the base is the freezing level itself, so you need the freezing level contours to know where the ice is expected to start.
Turbulence
Turbulence areas are outlined in red and filled with hatching. Hatching that slopes up to the right is low level turbulence, and hatching that slopes down to the right is high level turbulence. Light hatching is moderate and dense hatching is severe.
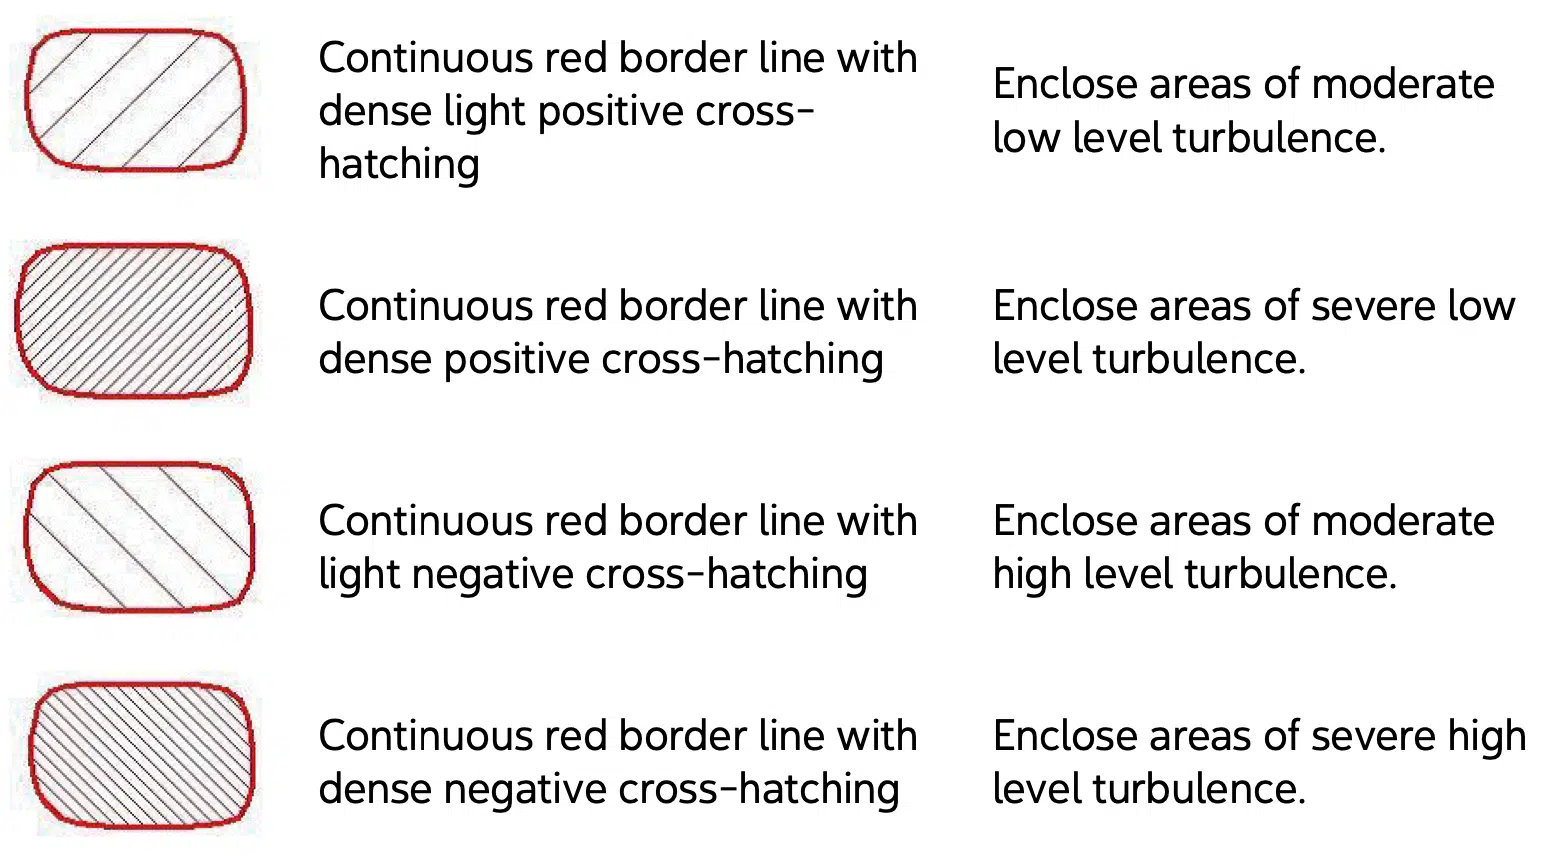
The forecaster also tells you what’s causing it:
| Code | Type of turbulence |
|---|---|
| MECH | Mechanical, from strong wind over terrain and obstacles |
| L LVL WS or LLWS | Low level wind shear |
| LEE | Lee waves, downwind of mountains |
| MV | Mountain waves |
| LLJ | Low level jet |
| CAT | Clear air turbulence |
Freezing level
Freezing level contours are the dashed lines running across the chart, drawn at 2,500 foot intervals starting at the surface and labelled in hundreds of feet ASL. A dashed line labelled 100 is a forecast freezing level of 10,000 feet. On an early spring or late fall day, following those lines along your route tells you where the forecaster expects ice to become possible in cloud or precipitation.
Low level jet
A low level jet is shown when the forecast core speed is 50 knots or more, or when there’s turbulence associated with it. If one is forecast across your route at night, plan for a rough climb and wind at altitude that looks nothing like the surface wind.
Complete GFA symbols legend
These are the GFA symbols for fronts and pressure systems you’ll see on every Canadian chart, and what each one means for your flight.
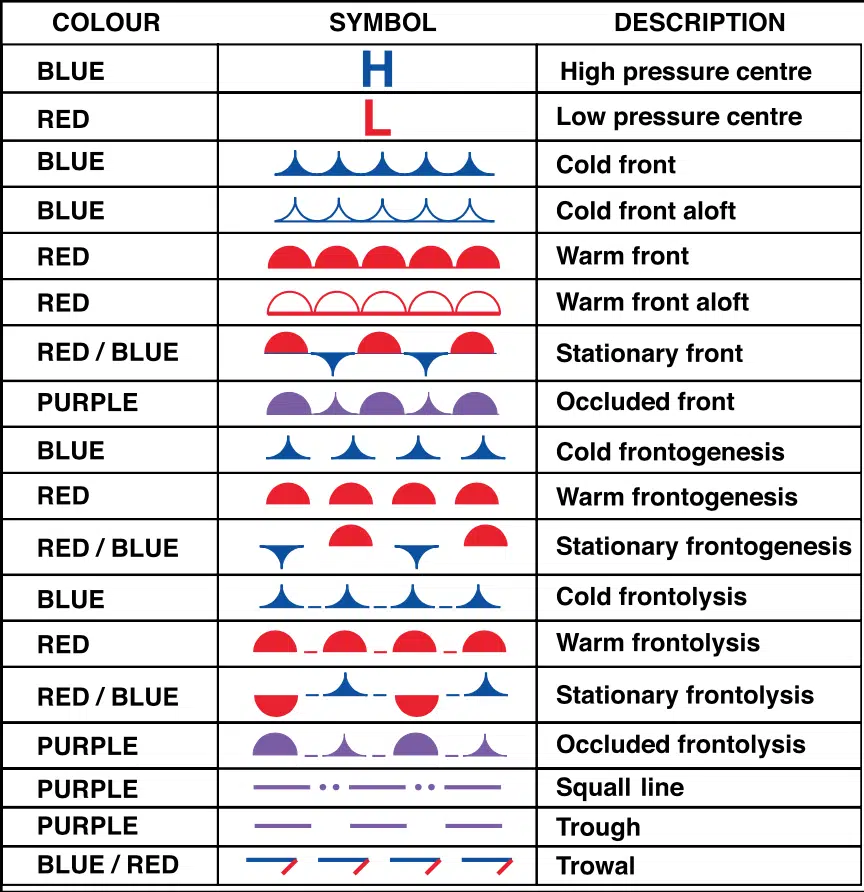
| Symbol | Colour | What it means for you |
|---|---|---|
| H | Blue | High pressure centre. Generally settled weather, but watch for fog and haze under a stagnant high. |
| L | Red | Low pressure centre. Rising air, cloud and precipitation, usually worst near the centre and along its fronts. |
| Cold front | Blue, solid triangles | Cold air pushing under warm air. A narrow band of CB, showers and gusty winds, often clearing quickly behind it. |
| Cold front aloft | Blue, open triangles | A cold front that isn’t reaching the surface. The weather is up high, so expect cloud and convection without a clean wind shift on the ground. |
| Warm front | Red, solid half circles | Warm air sliding over cold. A wide area of lowering stratus and steady precipitation, and freezing rain in winter. |
| Warm front aloft | Red, open half circles | A warm front above the surface. Layered cloud and precipitation without the surface change. |
| Stationary front | Red and blue, alternating | A front that isn’t moving. Its weather can sit over the same airports all day. |
| Occluded front | Purple | Where a cold front has caught the warm front. A mix of both, often with embedded CB. |
| Cold frontogenesis | Blue, triangles with gaps | A cold front forming. Expect its weather to develop during the chart period. |
| Warm frontogenesis | Red, half circles with gaps | A warm front forming. |
| Stationary frontogenesis | Red and blue, with gaps | A stationary front forming. |
| Cold frontolysis | Blue, triangles joined by dashes | A cold front weakening. Its weather should ease, but don’t count on it until it has. |
| Warm frontolysis | Red, half circles joined by dashes | A warm front weakening. |
| Stationary frontolysis | Red and blue, joined by dashes | A stationary front weakening. |
| Occluded frontolysis | Purple, joined by dashes | An occluded front weakening. |
| Squall line | Purple, dashes and double dots | A line of thunderstorms ahead of a cold front. Some of the worst weather on the chart. Don’t try to pick your way through one. |
| Trough | Purple, dashed | An elongated area of low pressure. Often a line of cloud and showers without a proper front. |
| Trowal | Blue and red | A trough of warm air aloft, usually wrapped around a mature low. Brings widespread cloud and precipitation, often well away from the low itself. |
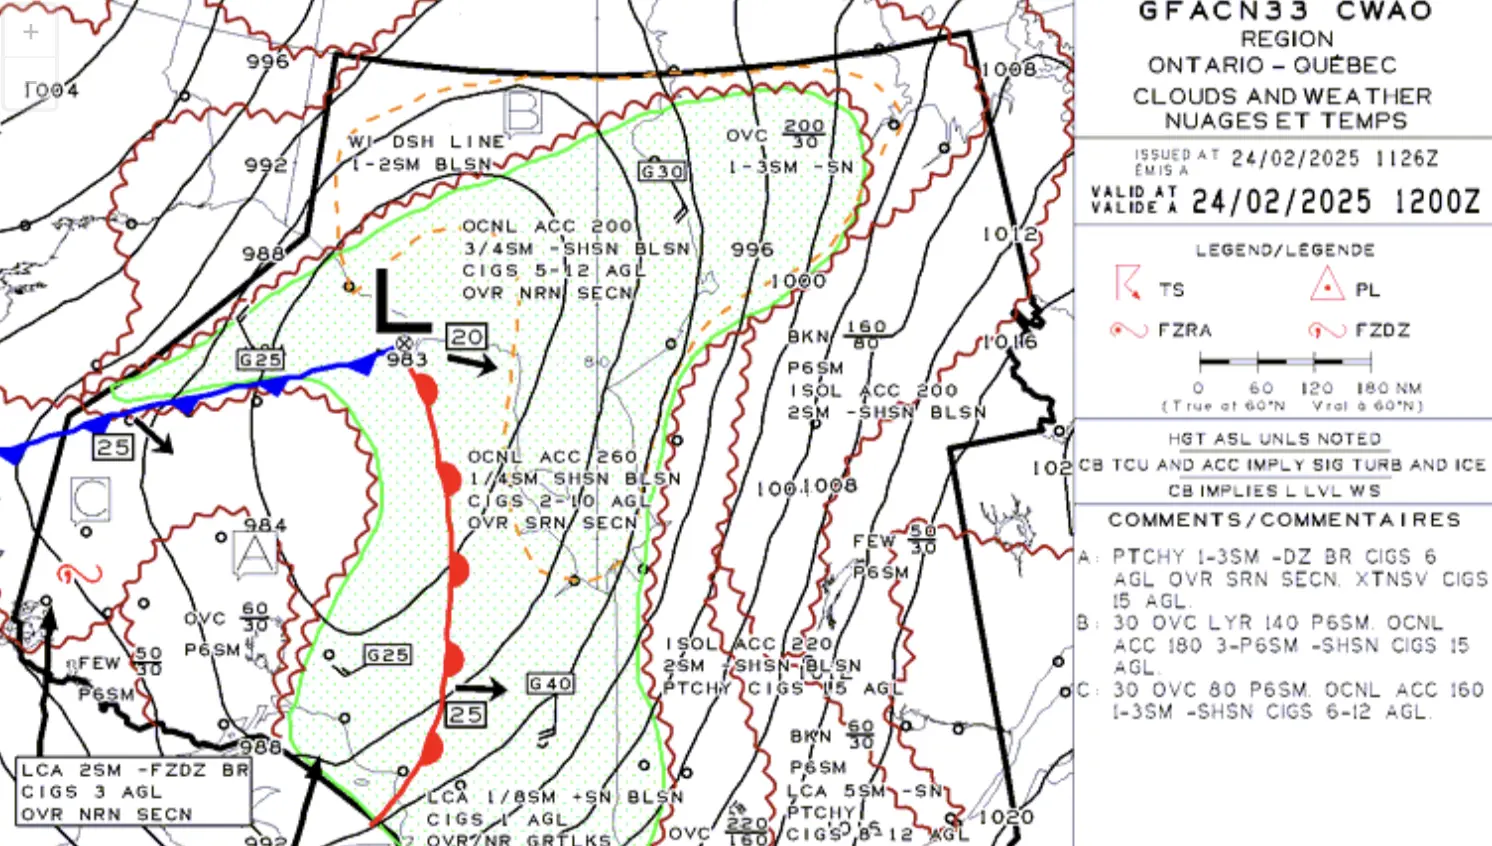
Worked example: reading the Ontario and Quebec clouds and weather chart
This is the real GFACN33 clouds and weather chart issued at 2325Z on August 8, 2026, valid at 0000Z on August 9. Here’s how I’d go through it with a student before a flight. Everything on it is what the forecaster expected at 0000Z. What actually happened that evening could have been better or worse.
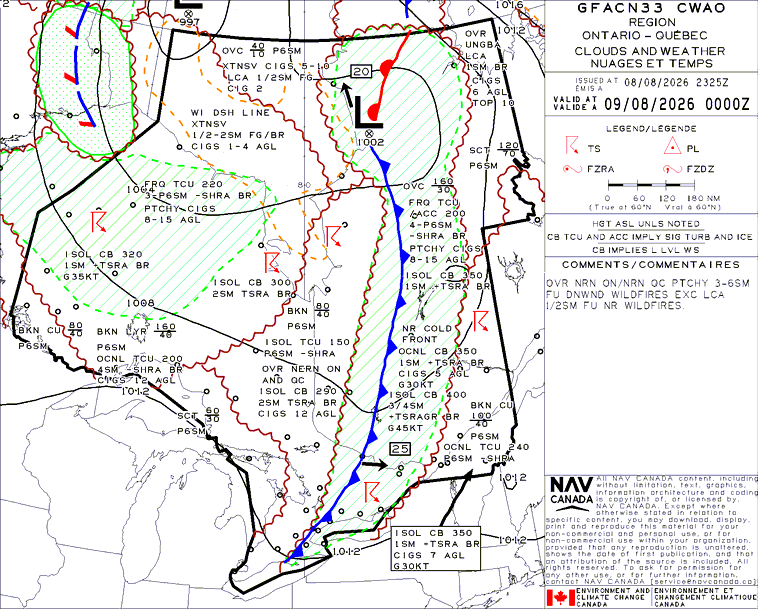
- Title box. Ontario and Quebec, clouds and weather, valid 0000Z. That’s 8 pm Eastern daylight time on the evening of August 8.
- The big picture. A 1002 hPa low is forecast over northern Quebec, moving northwest at 20 knots. A cold front is forecast to trail south from it through western Quebec and eastern Ontario, moving east at 25 knots. Almost all the significant weather on this chart is forecast along that front.
- Along the front. The labels read
OCNL CB 350 1SM +TSRA BR CIGS 5 AGL G30KTand, further south,ISOL CB 400 3/4SM +TSRAGR BR G45KT. That’s a forecast of occasional thunderstorms with tops at 35,000 feet, a mile in heavy rain, ceilings 500 feet above ground and gusts to 30 knots, then isolated storms topping out at 40,000 feet with hail and gusts to 45. If the front moves east at the forecast 25 knots, an airport 50 miles ahead of it could see this in about two hours. It could also be slower or faster, which is why you keep checking METARs and weather radar along the way. - Behind the front. West of the line the forecast is mostly
BKN CU 80/40andP6SM, broken cumulus between 4,000 and 8,000 feet with good visibility, plus scattered TCU and isolated showers. If that holds, it’s flyable VFR with some care. - Northwestern Ontario. The dashed orange area says
WI DSH LINE XTNSV 1/2-2SM FG/BR CIGS 1-4 AGL. Within the dashed line, extensive fog and mist is forecast, half a mile to two miles, with ceilings 100 to 400 feet above ground. Not VFR by anyone’s standard. - Comments box.
OVR NRN ON/NRN QC PTCHY 3-6SM FU DNWND WILDFIRES EXC LCA 1/2SM FU NR WILDFIRES. Over northern Ontario and Quebec, patchy smoke is forecast downwind of wildfires, cutting visibility to 3 to 6 miles, and locally to half a mile near the fires. None of that is drawn on the map. If you only looked at the picture, you’d miss it.
So if you were planning a VFR flight from Ottawa to Montreal that evening, this forecast says wait until the front has passed and the METARs confirm it. If you were going west from Sudbury, the concern is forecast fog, not thunderstorms. Same chart, two completely different briefings.
Worked example: reading the Yukon and NWT icing chart
This is the GFACN35 icing, turbulence and freezing level chart for the Yukon and Northwest Territories, from the same issue and valid at the same time, 0000Z on August 9, 2026.
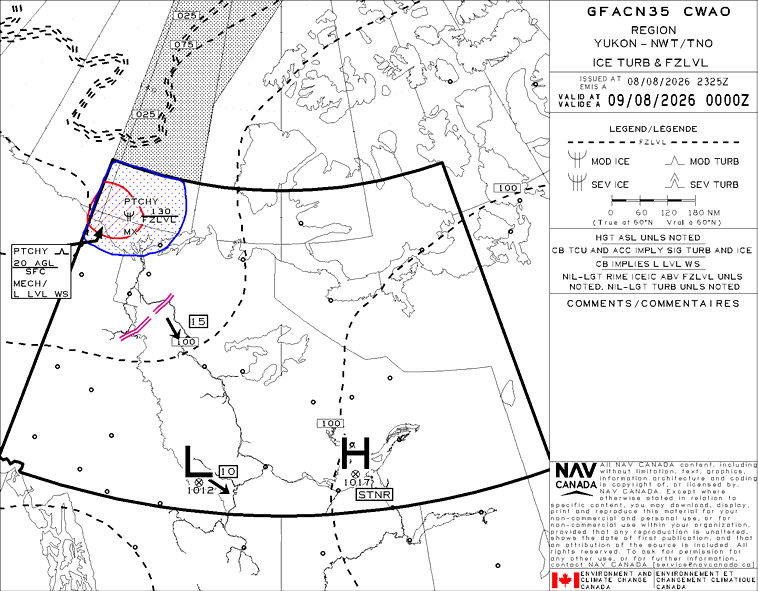
- Title box. Yukon and NWT, ICE TURB and FZLVL, valid 0000Z. The legend notes remind you that anything not drawn is nil to light.
- The blue area in the northwest. Light stippling inside a blue line, so moderate icing. The label says
PTCHY, the moderate icing symbol, thenMX 130/FZLVL. That’s patchy moderate mixed icing forecast from the freezing level up to 13,000 feet. - The red area overlapping it. The box pointing into it reads
PTCHY, the moderate turbulence symbol,20 AGL/SFCandMECH/L LVL WS. Patchy moderate mechanical turbulence and low level wind shear are forecast from the surface up to 2,000 feet above ground. Low, bumpy and right where you’d be on approach. - Freezing level. Follow the dashed lines and their labels. Where you see 100, the forecast freezing level is 10,000 feet. In August that’s normal. In October the freezing level could be forecast near the surface, and then that icing area would start at the ground.
- Pressure systems. A 1012 low is forecast in the south, moving southeast at 10 knots, and a 1017 high is forecast to stay put, marked STNR for stationary. Nothing dramatic is expected, which is why most of the chart is blank.
Put together, the forecast for a VFR flight in the southern Yukon that evening looks fine. Anything going into cloud near the northwest coast, or low level flying there, needs a second look and a check of the latest PIREPs.
Canadian Aviation Weather, 3rd Edition
The standard Canadian weather reference, and the book we point every student to when they want to go deeper than the exam. It covers GFAs, fronts, icing and the weather patterns you’ll actually fly in across Canada.
See the bookGoing for your commercial?
The CPAER goes further into weather than the private exam, with more on upper air, icing and frontal analysis. Our Commercial Pilot Ground School covers it, and includes the Night Rating and Multi-Engine courses at no extra cost.
See the CPL courseGFA abbreviations you’ll see most
Along with the GFA symbols, these are the abbreviations that show up on almost every chart. Most of them are the same as METARs and TAFs, which is one more reason to learn them once and properly.
| Abbreviation | Meaning |
|---|---|
| CB | Cumulonimbus |
| TCU | Towering cumulus |
| ACC | Altocumulus castellanus, a sign of mid level instability |
| CIGS | Ceilings |
| P6SM | Visibility greater than 6 statute miles |
| TSRA, SHRA | Thunderstorm with rain, rain showers |
| GR | Hail |
| FG, BR, HZ, FU | Fog, mist, haze, smoke |
| FZRA, FZDZ | Freezing rain, freezing drizzle |
| FZLVL | Freezing level |
| MX, CLR | Mixed icing, clear icing |
| STNR | Stationary |
| WI DSH LINE | Within the dashed line |
| AGL, ASL | Above ground level, above sea level |
| UNLS | Unless |
| DNWND, NR, EXC | Downwind, near, except |
For the full list, the weather section of the Transport Canada AIM is the official source, and our aviation glossary covers the terms in plain English. If you want to calculate a cloud base yourself from a METAR, we’ve written up the cloud base formula too.
Before your next flight
Read all six charts, not just the one valid closest to your departure. The trend matters more than any single picture. Is the front forecast to speed up or slow down? Is the fog area expected to grow? Is the freezing level forecast to come down? Then check the GFA against the METARs, TAFs and PIREPs along your route. The METARs and PIREPs are what’s actually happening, so if they’re worse than the GFA, believe them. And if the observations and the forecast disagree, plan for the worse of the two until you know why.
Frequently asked questions
What is a GFA in aviation?
A GFA, or Graphical Area Forecast, is a set of six forecast charts covering one region of Canada from the surface to 24,000 feet. Three show clouds and weather, and three show icing, turbulence and freezing level, each valid at the issue time and six and twelve hours later.
Where do I find the GFA in Canada?
On NAV CANADA’s Collaborative Flight Planning Services site at plan.navcanada.ca, under the Weather tab. The old AWWS website was retired in February 2024.
How often are GFAs issued?
Four times a day, about 30 minutes before 00Z, 06Z, 12Z and 18Z. They’re prepared by Environment and Climate Change Canada.
How do you read cloud heights on a GFA?
Cloud tops and base are written as a fraction in hundreds of feet above sea level, tops over base. BKN 80/40 means broken cloud with a base of 4,000 feet ASL and tops of 8,000 feet. Heights marked AGL are above the ground instead.
Why is there no icing on the GFA?
The GFA only draws moderate and severe icing and turbulence. Nil to light rime icing above the freezing level and nil to light turbulence are assumed everywhere else, as noted in the chart legend.
Is the GFA on the Transport Canada pilot exams?
Yes. Reading a GFA is tested on the private and commercial pilot written exams, along with METARs, TAFs and other weather products. Expect questions on symbols, cloud heights, coverage terms and validity times.
Learn weather the way pilots actually use it
Canadian Flight Trainers teaches ground school online for every Transport Canada pilot licence, built and taught by working airline pilots. Every course starts with a free 7 day trial.
Our Online Pilot Training Courses
-

Private Pilot Ground School Course
From: $199.00 every 4 months -

Commercial Pilot Ground School
From: $199.00 every 4 months -

Night Rating Course
$39.95 for 4 months -

Radio Operator’s Certificate – Aeronautical
$24.95 for 4 months -

PSTAR Study Course




- Air Canada Pilot Salary: How Much Air Canada Pilots Make in 2026
 Updated September 2026 for the current Air Canada pilot contract. This article was written by a guest columnist who works at Air Canada as a Captain on a narrow…
 - How to Calculate Cloud BasesAviation Weather How to Calculate Cloud Bases: The Formula Every Pilot Should Know Weather and clouds play a big role in aviation, and one of the most useful skills…
- Night Rating Requirements in CanadaThe night rating is the most commonly added rating to a Private Pilot License in Canada, and for good reason. During night operations, pilots will not generally encounter rising…
- AWWS GFA
AWWS was retired on February 28, 2024. NAV CANADA’s Aviation Weather Web Site no longer exists. Everything it did now lives on CFPS — the live GFA links below…
- Commercial Pilot Ground School – What Our Students ExpectCommercial Pilot Ground School Research What Students Expect From CPL Ground School: 260 Responses Analyzed Commercial students arrive with a licence, some experience, and much less patience for wasted…
- Private Pilot Ground School – What Students ExpectPrivate Pilot Ground School Research What Students Expect From PPL Ground School: 1,000+ Responses Analyzed Before students begin our Private Pilot Ground School, we ask what they hope to…
- Canadian Pilot Training and Licensing Statistics in 2025/2026Transport Canada Data Analysis Canadian Pilot Training and Licensing Statistics in 2025/2026 Transport Canada presented its newest pilot training and licensing update at an ATAC meeting on June 3,…
- Pilot Bag
What is a pilot bag? A pilot bag is also known as a flight bag. It is a bag used by pilots at all stages in their flying to…
- What PSTAR Students Say About Flight Training in CanadaPSTAR Student Response Analysis What PSTAR Students Are Really Telling Us About Flight Training We reviewed 3,429 written answers from students signing up for our free PSTAR course. The…



Chart images (c) NAV CANADA / ECCC